
Espresso test reporting
Qualflare ships a native Espresso reporter that runs inside
the instrumented app and records what the run actually did — screenshots, steps, per-attempt retry
history and your own metadata — then reaches the host without a single
adb command. If you would rather add nothing to the
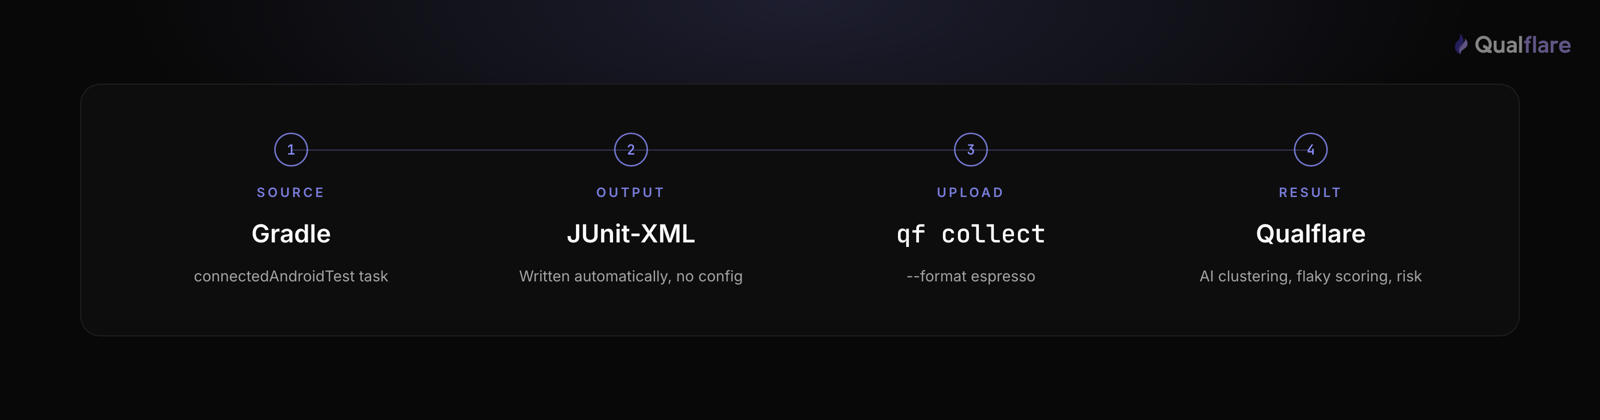
build, the JUnit-XML that ./gradlew connectedAndroidTest
already writes still uploads as-is. This guide covers both, CI patterns for emulators, and the
hosted, historical analysis —
AI failure clustering, flaky-test scoring, and per-launch risk — that sits on top.
Espresso’s native JUnit-XML output, explained
Espresso is a Gradle-based, in-process UI testing framework — part of
AndroidX Test,
scoped to testing within your own app (an espresso-remote extension
covers multi-process scenarios inside that app). It complements, rather than competes with,
UI Automator,
which tests from outside the app’s process and can drive other apps and system UI — Espresso stays
in-app.
Running the instrumented test task uses AndroidJUnitRunner, which writes results as a documented, automatic side effect of the task — no reporter to add, no config to edit:
# Run the instrumented suite via Gradle — writes results automatically
./gradlew connectedAndroidTest

# JUnit-XML lands at:
# app/build/outputs/androidTest-results/connected/**/*.xml
# A matching HTML report lands at:
# app/build/reports/androidTests/connected/index.html
Both paths are documented behavior of the
Android Gradle plugin’s command-line test tasks —
not a side effect you have to opt into. Any CI job that runs
connectedAndroidTest already has a JUnit-XML
file sitting in build/outputs when the task
finishes — with no format to configure and no conversion step, unlike iOS, where Xcode’s
.xcresult bundles need a converter before they become
JUnit-XML (see our XCTest reporting guide). That
file is the floor, not the ceiling: it carries a status, a duration and a class name per test, and
nothing else. Everything the run saw — the screenshot at the moment of failure, the steps leading to
it, whether a retry turned it green — is gone by the time the XML is written. That is what the native
reporter is for.
Why the raw XML (and its HTML report) isn’t enough
The auto-generated HTML report is genuinely useful — open
index.html and you get a browsable summary of
the run with zero setup. But like Playwright’s HTML reporter, it’s built for inspecting one
run. It’s written to a local build/reports folder
and overwritten the next time the task runs. There’s no history across CI builds, no aggregation
when a suite is split across multiple emulators, and no way to see whether a test has gotten
flakier over the last two weeks. You can archive each run’s XML and HTML as CI artifacts, but a
pile of zip files per build is storage, not reporting — nothing connects build #1481 to build
#1482, and nobody opens them.
For anything beyond a single run, you need a place that collects results over time and analyzes them: trend lines, flakiness scores, failure grouping. That’s the gap the rest of this guide fills — first the CI plumbing, then the analysis layer.
CI patterns: GitHub Actions, GitLab, Jenkins
GitHub Actions. Android instrumented tests need a running
emulator, so most GitHub Actions setups use a community action like
reactivecircus/android-emulator-runner to boot
one, then run connectedAndroidTest inside it.
Upload results even when tests fail — a reporting step that only runs on green builds is useless on
the day you need it:
# .github/workflows/android.yml
- name: Run Espresso tests on an emulator
  uses: reactivecircus/android-emulator-runner@v2
  with:
    api-level: 34
    script: ./gradlew connectedAndroidTest

- name: Upload results to Qualflare
  if: always() # upload even when tests fail — that's the point
  run: qf myapp collect app/build/outputs/androidTest-results/connected/**/*.xml --format espresso
GitLab CI. GitLab renders JUnit XML natively in the pipeline’s Tests tab, the same way it does for any framework — run the task on a runner with an SDK, emulator (or hardware-accelerated KVM), and Gradle already set up, then declare the XML as a JUnit report:
# .gitlab-ci.yml — JUnit XML doubles as GitLab's native test report
espresso:
  script:
    - ./gradlew connectedAndroidTest
  artifacts:
    when: always
    reports:
      junit: app/build/outputs/androidTest-results/connected/**/*.xml
    paths:
      - app/build/reports/androidTests/connected/
Jenkins. Same idea: run
./gradlew connectedAndroidTest, hand the
resulting XML to the classic
junit 'app/build/outputs/androidTest-results/connected/**/*.xml' pipeline
step for Jenkins’ own build-level pass/fail tracking, then upload the same file with
qf collect for the analysis layer Jenkins doesn’t
provide.
Whatever the platform, the principle is the same as every other framework Qualflare supports:
run the suite, upload the results file with
if: always() semantics — one extra step, not a rewrite.
Common Espresso reporting problems (and fixes)
Mobile CI flakiness is a measured, growing problem, not just a feeling: Bitrise’s 2025 Mobile Insights Report found the share of teams experiencing test flakiness grew from 10% in 2022 to 26% in 2025. Most of the causes below are specific to running a UI test against a virtual device rather than a plain JVM.
- Emulator instability in CI. CI-hosted emulators are often headless and, without hardware acceleration (KVM on Linux runners), meaningfully slower than a developer’s local machine — timing-sensitive assertions that pass locally can fail intermittently in CI simply because the device is slower, not because the app is broken.
- Animations causing intermittent failures. Google’s own Espresso setup guide is direct about this: “To avoid flakiness, we highly recommend that you turn off system animations” — Window animation scale, Transition animation scale, and Animator duration scale, all under Developer options — on any device or emulator used for testing (developer.android.com).
- Async operations without an IdlingResource. Espresso’s
synchronization only covers operations posted to the app’s
MessageQueue— network calls, database writes, and background work outside that queue need an IdlingResource registered, or Espresso can act before the async work finishes. Google’s docs warn that the usual workaround —Thread.sleep()— “might still fail sometimes when executed on slower devices,” which describes a CI emulator almost exactly. - Sharding across multiple emulators. AndroidJUnitRunner
supports splitting a suite with
-e numShards/-e shardIndexinstrumentation arguments, so teams commonly run N emulators in parallel, each executing one shard. Unlike Playwright, there’s no built-in merge tool — each shard writes its own separate XML file:
# AndroidJUnitRunner shards natively — split into 4, run each on its own emulator/job
adb shell am instrument -w -e numShards 4 -e shardIndex 0 \
  com.myapp.test/androidx.test.runner.AndroidJUnitRunner
# (repeat with shardIndex 1, 2, 3 on parallel CI jobs)
# No merge-reports equivalent for Espresso — upload each shard's XML separately
qf myapp collect shard-0-results.xml --format espresso
qf myapp collect shard-1-results.xml --format espresso
# ...repeat per shard; all land in the same project- The results file is missing after a timed-out run. AndroidJUnitRunner writes its XML when the task finishes — if the CI job is killed by a timeout (a common failure mode when a cold-booting emulator eats into the test budget) or runs out of memory, the file may never be written. Set the CI job timeout comfortably above how long the suite plus emulator boot actually takes, so the task ends and reports rather than getting killed mid-run.
Send Espresso results to Qualflare
The native reporter is a test-only dependency plus one instrumentation argument. It runs inside the app under test, so it sees the run rather than its summary:
// app/build.gradle.kts
dependencies {
    androidTestImplementation("com.qualflare:qualflare-espresso:0.1.0")
}

android {
    defaultConfig {
        // JUnit 4 has no ServiceLoader hook, so the listener is named explicitly
        testInstrumentationRunnerArguments["listener"] =
            "com.qualflare.espresso.QualflareRunListener"
    }
}
That argument names the listener as a string because JUnit 4 has no ServiceLoader hook —
which is also why it composes with whatever runner you already have, Hilt’s included, where shipping
an AndroidJUnitRunner subclass would fight it. The
AAR carries its own ProGuard rules, so a minified androidTest APK needs nothing from you.
Then run the suite you already run. The report is written through
androidx.test storage into the directory Gradle
already collects, so it arrives on the host by itself:
./gradlew connectedAndroidTest

# The report is pulled to the host by Gradle itself — no adb command
qf myapp collect app/build/outputs/connected_android_test_additional_output
That no-adb path holds from
API 29, which is where Gradle starts passing
additionalTestOutputDir. On API 24–28 it passes
nothing, so the reporter writes into the app’s own files directory and prints the exact commands to
pull it — including the flag that keeps the APKs installed, because
connectedAndroidTest otherwise uninstalls the app
and deletes the report with it. Both paths are verified on emulators at API 24, 29 and 34, plain and
under Android Test Orchestrator.
The reporter makes no network call — it writes files, and the CLI uploads them. What a test can add to its own report:
@Test
public void signsIn() {
    Qualflare.label("team", "identity");
    Qualflare.tag("smoke");
    Qualflare.step("enter credentials", () -> {
        onView(withId(R.id.email)).perform(typeText("[email protected]"));
    });
}

// Screenshot on failure, while the app is still on screen.
// The ordering is load-bearing: the rule must be INSIDE the activity's rule.
@Rule
public final RuleChain rules = RuleChain
        .outerRule(new ActivityScenarioRule<>(LoginActivity.class))
        .around(new QualflareRule());
Automatic capture cannot live in the listener, and the reason is worth knowing if you have ever tried
it: JUnit runs the @After methods and
then reports the failure, so by the time a listener hears about it
ActivityScenarioRule has already closed the
activity — and the screenshot is of the launcher. Only a rule declared inside the activity’s rule sees
the app.
Without the reporter: uploading JUnit-XML
If you would rather add nothing to the build, the XML is already there once the task finishes — you get one case per test with a status and a duration, and nothing inside it. Point the CLI at the file:
# Upload the XML — --format labels it Espresso for detection
qf myapp collect app/build/outputs/androidTest-results/connected/**/*.xml --format espresso
The general shape is qf <project> collect [files...] [flags].
Useful flags: --environment,
--branch,
--commit, and
--dry-run to preview what would be uploaded.
In CI it’s the one extra step shown in the GitHub Actions snippet above — and identical in GitLab
CI, Bitbucket Pipelines, and Jenkins. Authenticate the CLI once with your Qualflare access token,
stored as a CI secret — see the
CLI docs.
What you get on top of raw XML
- AI failure clustering. When a backend change breaks 30 Espresso tests across a dozen activities and fragments, Qualflare groups them by root cause so you triage a handful of clusters instead of 30 stack traces.
- Flaky-test scoring, two ways. The native reporter records every attempt at a test, so a rerun that turned green arrives already marked flaky with its failures intact. On the XML path that metadata does not exist — JUnit-XML has nowhere to put it — so Qualflare scores flakiness by tracking each test’s pass/fail pattern across launches instead, surfacing the intermittent ones even when no single run flags them.
- Per-launch risk. Every CI run becomes a “launch” with a risk rating, the failing areas, and recommended next steps — a ship / don’t-ship signal that arrives with the results, across every emulator, API level, or shard you test against.
- History & trends. Pass rate, slowest tests, and flakiness over time across branches and shards — the aggregation the local HTML report can’t do.
- Context & defects. Failures keep their JUnit stack trace and logcat context where captured, and you can spin up a defect straight from a failing run.
Espresso’s HTML report vs Qualflare
| Espresso HTML report | Qualflare | |
|---|---|---|
| History across CI runs | — | Yes |
| Aggregates sharded / multi-emulator runs | Manual (no built-in merge) | Yes |
| AI failure clustering (root cause) | — | Yes |
| Flaky-test scoring over time | — | Yes |
| Screenshot at the moment of failure | — | With the reporter |
| Steps, labels, tags and links per test | — | With the reporter |
| Per-attempt retry history | — | With the reporter |
| Local, zero-setup, offline | Yes | — |
| Human-readable without extra tooling | Yes | Yes |
They’re complementary: keep the auto-generated HTML report for local debugging, add Qualflare for hosted, historical CI observability.
Get AI analysis on your Espresso runs
Start free — run connectedAndroidTest, upload with qf collect, and get your first AI analysis in minutes.
Building out the rest of your mobile stack? See our guides to XCTest reporting for iOS and Maestro reporting for cross-platform E2E flows, or the full list of 23+ supported frameworks. For the bigger picture on getting Android and iOS results into one place, read unifying Android and iOS test reporting, fixing flaky mobile tests, or the complete guide to mobile test management. Want the detail on what the JUnit file does and does not carry, and the Android traps in capturing the rest? See what Espresso’s JUnit XML leaves out, measured on emulators from API 24 to 34. Weighing tools? See how Qualflare compares to other test management platforms, or browse all framework reporting guides.
Frequently asked questions
Does Qualflare run my Espresso tests on real devices or emulators?
No. Qualflare is a results-management and observability layer, not a device-execution cloud — it never provisions or touches emulators, simulators, or real devices, and it doesn’t schedule your test run. It only needs the JUnit-XML file your run already produced, so it works identically whether that run happened on a local emulator, a CI-hosted emulator (GitHub Actions, GitLab), a self-hosted device farm, or a third-party device cloud like Firebase Test Lab, BrowserStack, or Sauce Labs.
Which Android test frameworks does Qualflare support?
Espresso has a native reporter that runs on the device. UI Automator tests run through the same AndroidJUnitRunner and the same JUnit 4 notifications, and the reporter never requires Espresso at runtime — it declares every androidx.test dependency compileOnly and classifies failures by exception type name rather than by type, precisely so a suite with no Espresso on its classpath still reports. Our own device suite exercises the Espresso path, so treat UI Automator as supported by design rather than by test. Maestro has its own native reporter for cross-platform Android/iOS flows. Any other Android runner that emits JUnit-compatible XML works through Qualflare’s generic ingestion even without a named integration. See the full list on the frameworks page.
Do I need the Qualflare reporter, or is JUnit-XML enough?
Either works. Running ./gradlew connectedAndroidTest writes JUnit-XML automatically, and Qualflare uploads it as-is — one case per test with a status, a duration and a class name. The native reporter (com.qualflare:qualflare-espresso, a test-only dependency plus one instrumentation argument) adds what that file has nowhere to put: a screenshot taken at the moment of failure while the app is still on screen, the steps leading to it, per-attempt retry history, and labels, tags and links written by the test itself. Start with the XML if you cannot change the build; add the reporter when you want to know why a test failed rather than that it did.
Does Qualflare have Espresso-specific support?
Yes — a native reporter that runs inside the instrumented app, on the device. It knows Espresso’s own exception family, so a NoMatchingViewException is reported as a failed assertion rather than an infrastructure error (which is what a generic parser makes of the commonest Espresso failure), an AppNotIdleException becomes a timeout, and a @BeforeClass that throws still produces a case instead of quietly shrinking the suite. If you upload JUnit-XML instead, that path is the generic JUnit-XML-compatible one shared with every other XML framework, and --format espresso only labels the launch.
How do I send Espresso results to Qualflare?
With the native reporter: add androidTestImplementation("com.qualflare:qualflare-espresso:0.1.0") and the listener instrumentation argument, run ./gradlew connectedAndroidTest, then point the CLI at the directory Gradle already pulls off the device — qf <project> collect app/build/outputs/connected_android_test_additional_output — with no adb command on API 29 and up. Without the reporter: run the same Gradle task and upload the XML it writes, qf <project> collect app/build/outputs/androidTest-results/connected/**/*.xml --format espresso. Either way the CLI attaches your Git branch and commit automatically.
Does Qualflare detect flaky Espresso tests?
Yes, and with the native reporter it is direct rather than inferred: the reporter records every attempt at a test, so a rerun that eventually passed arrives marked flaky with each failed attempt still attached. On the JUnit-XML path that metadata does not exist — the format has nowhere to put it — so Qualflare scores flakiness by watching each test’s pass/fail pattern across launches instead: a test that alternates between green and red across otherwise-identical runs gets flagged, even though no single XML file says “flaky.”
Setup reflects the Qualflare CLI (docs.qualflare.com) and Android/AndroidX Test documentation as of August 2026. Published 14 August 2026. Written by İbrahim Süren, founder of Qualflare.