
Maestro test reporting
Maestro’s JUnit-XML gives you one line per flow: a status, a duration, a message. The flow itself —
every tapOn and
assertVisible Maestro just ran, and the screenshots it
took when one failed — is left on the CI worker. Qualflare turns
those runs into hosted, historical reporting —
AI failure clustering, flaky-flow scoring, per-launch risk — through a
native Maestro reporter that
keeps a step per command, the screenshots, and the runs that die before Maestro writes a file at all.
The JUnit-XML path still works, and is covered below.
Worth saying up front: Qualflare doesn’t run your Maestro flows, and neither does the reporter own your
devices — it wraps the maestro test command you already
run, wherever it already runs. Qualflare is a results and observability layer, not a device-execution
cloud.
How Maestro flows and JUnit reporting work
Maestro is an open-source, YAML-based UI testing framework for Android, iOS, and web apps, built by
mobile.dev. A “flow” is a plain YAML file — launchApp,
tapOn, inputText,
assertVisible — with no compiled test code, and the same
flow file can drive an Android build and an iOS build of the same app, since Maestro interacts with the
UI/accessibility tree rather than framework-specific code:
# .maestro/login.yaml — a Maestro flow: readable YAML, not code
appId: com.example.app
---
- launchApp
- tapOn: "Log In"
- inputText: "[email protected]"
- tapOn: "Password"
- inputText: "hunter2"
- tapOn: "Submit"
- assertVisible: "Welcome back"
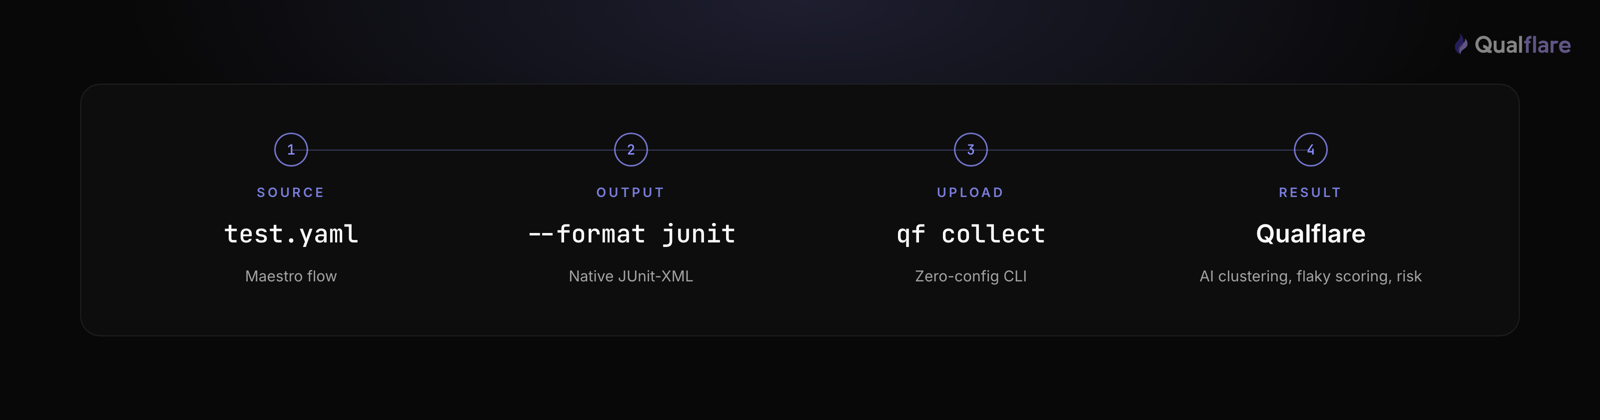
Maestro ships its own JUnit reporter out of the box — the same simplicity as Espresso, no conversion step. One flag writes a standard JUnit-XML report:
# Run every flow in a directory, write one JUnit-XML report
maestro test --format junit --output maestro-results.xml .maestro/
Per Maestro’s own docs,
“JUnit is the standard for CI/CD integration and for test reporting.” Point the command at a directory
and every flow inside it lands in the same report — one <testsuite> element,
one <testcase> per flow. HTML and
html-detailed formats exist too, with screenshots
of failed steps, but for CI pipelines and any downstream tool — Qualflare included — JUnit-XML is the
one that matters. Maestro is also actively developed: the project has
15,000+ GitHub stars and
ships releases roughly every one to four weeks, so the CLI surface is worth checking against its own
docs periodically rather than assuming a syntax learned a year ago still holds.
Why maestro test’s own report isn’t enough for CI-wide reporting
The JUnit-XML file maestro test writes is excellent
at describing one run — which flows passed, which failed, and why. Its limits show up the same
way any single-run report’s do: nothing connects today’s report.xml to
yesterday’s. Run the suite again tomorrow and you get a new file, usually written to the same path, so
it overwrites the last one unless you explicitly archive it as a CI artifact. There’s no history across
runs, no way to tell whether a specific flow has been getting flakier over the last two weeks or just
had a one-off environment hiccup, and — for teams running Espresso on Android and XCTest on iOS alongside
Maestro for cross-platform E2E, a common setup — no way to see all three as one release-health picture.
For anything beyond a single CI run, you need a place that collects results over time and analyzes them across runs and frameworks. That’s the gap the rest of this guide fills — the CI plumbing, the native reporter that records what happened inside each flow, and the analysis on top.
CI patterns: GitHub Actions, GitLab CI, and Maestro Cloud
GitHub Actions. Run the flows against whatever emulator or simulator the job already has connected, with the native reporter wrapping the command, then upload — always, even on failure, since a failing run is the one you most need reported:
# .github/workflows/mobile-e2e.yml
maestro-e2e:
  runs-on: macos-15 # or ubuntu-latest with a connected Android emulator
  steps:
    - uses: actions/checkout@v4
    - name: Run Maestro flows
      run: qualflare-maestro -- maestro test .maestro/
    - name: Upload results to Qualflare
      if: always() # upload even when flows fail — that's the point
      run: qf myapp collect ./qualflare-results
Without the reporter the shape is the same, with Maestro writing JUnit-XML and
--format maestro on the upload:
# .github/workflows/mobile-e2e.yml
maestro-e2e:
  runs-on: macos-14 # or ubuntu-latest with a connected Android emulator
  steps:
    - uses: actions/checkout@v4
    - name: Run Maestro flows
      run: maestro test --format junit --output maestro-results.xml .maestro/
    - name: Upload results to Qualflare
      if: always() # upload even when flows fail — that's the point
      run: qf myapp collect maestro-results.xml --format maestro
GitLab CI. GitLab renders JUnit XML natively in the pipeline’s
Tests tab, and that is a real reason to keep the XML path: the reporter owns
--output and clears the file away once it has read it,
so a single run cannot produce both its report and a JUnit file for GitLab to render. Pick per job — the
Tests tab, or the fuller report:
# .gitlab-ci.yml — JUnit output doubles as GitLab's native test report
maestro-e2e:
  script:
    - maestro test --format junit --output maestro-results.xml .maestro/
  artifacts:
    when: always
    reports:
      junit: maestro-results.xml
Maestro Cloud. mobile.dev’s own paid product is a different
piece of the puzzle: it’s a place to run flows — parallel execution across managed devices —
not a place to analyze results over time. If you execute flows on Maestro Cloud instead of (or
alongside) self-hosted emulators, the XML path is the one to use — the reporter works by wrapping the
maestro test command, which you don’t run when the
flows execute on managed devices. Point qf collect at
whatever JUnit-XML file that run produced. Qualflare cares about the results file, not where the flow
executed — check Maestro Cloud’s own CI integration docs for exactly how it exposes that file as a
build output or artifact.
Common Maestro reporting problems (and fixes)
None of this is a niche complaint — mobile build instability is measurably rising. The Bitrise Mobile Insights Report 2025 found the share of teams experiencing any test flakiness grew from 10% to 26% between 2022 and 2025. The issues below are the Maestro-flavored version of that trend.
- Flow YAML syntax errors fail silently, not loudly. A typo
in a selector, a wrong key name, or a missing
---document separator often doesn’t throw a clear parse error — it just makes a step never match, so the flow times out ontapOnorassertVisibleinstead of failing with an obvious “invalid flow” message. Before assuming it’s an app bug, re-run the flow with--debug-output ./maestro-debug, which writes step-by-step screenshots and view-hierarchy dumps you can diff against what the flow expected. - Element-matching timing on slower CI emulators.
assertVisibleandtapOnpoll against Maestro’s default ~7-second assertion timeout, which is usually enough on a fast local simulator but not on a cold-booted, hardware-acceleration-less CI emulator. For a genuinely slow step — payment confirmations, cold app starts — reach for an explicitextendedWaitUntil: { visible: "...", timeout: 30000 }rather than inflating the whole suite’s patience. - Sharded runs need real connected devices, not just a flag.
--shard-alland--shard-splitdistribute flows across N connected devices — they don’t provision devices for you. If fewer emulators or simulators are actually booted than the shard count, the run stalls or fails waiting on devices that don’t exist. Confirm the device count matches the shard count before raising either in CI. - The results file location becomes a collision risk. Omit
--outputand Maestro writesreport.xmlto the current working directory by default. Running multiple flows aggregates them into that one file correctly — but two parallel CI jobs (an Android emulator job and an iOS simulator job, say) that both omit--outputwill both write to the same default path and clobber each other. Give every job its own explicit--outputfilename, as in the snippets above. - The upload step never runs on a failing build. The same
ordering mistake as any framework: if the upload step doesn’t run with
if: always()(or the equivalent “run even on failure” setting on your CI platform), the failing run — the one you most need visibility into — never reaches Qualflare at all.
Send Maestro results to Qualflare
Maestro has no reporter or listener API — the report formats are a fixed list, and nothing loads code
into a run. So the native reporter runs maestro test itself:
it adds the output flags it needs, reads what Maestro leaves behind, and writes a report directory.
Install it once:
brew install qualflare/tap/qualflare-maestro
# or: go install github.com/Qualflare/qualflare-maestro/cmd/qualflare-maestro@latest
Then put qualflare-maestro -- in front of the command you
already run. Maestro’s exit code comes back unchanged, so nothing else in the job changes, and the
reporter makes no network calls — the CLI uploads the directory:
# Wraps maestro test — same flags, same exit code
qualflare-maestro -- maestro test .maestro/
qf myapp collect ./qualflare-results
qualflare-maestro .maestro/ is shorthand for the same
thing. Every other flag — --env,
--shard-all, tags, a device id — goes straight to
Maestro; the four output flags the reporter owns are the only ones you cannot pass yourself. It needs
Maestro 2.6.0 or newer, and screenshots upload with
qf 0.1.24 or newer. In CI it replaces the
maestro test step, as in the
GitHub Actions example above.
Without the reporter: uploading JUnit-XML
If you would rather not add a binary to the job, Qualflare still reads the JUnit-XML Maestro writes — you just get one case per flow and nothing inside it. Have Maestro write the file, which you’re probably already doing for GitLab or another CI test-report tab:
# Run every flow in a directory, write one JUnit-XML report
maestro test --format junit --output maestro-results.xml .maestro/
Then upload it, passing --format maestro so the launch
is labeled correctly:
# Upload the results — label the launch as Maestro explicitly
qf myapp collect maestro-results.xml --format maestro
Worth being precise about what that flag does: it routes through the exact same JUnit-XML-compatible
ingestion path every other JUnit-XML framework uses — Espresso, converted XCTest output, JUnit (Java),
and so on. There’s no bespoke Maestro-specific parsing logic behind it, because there’s nothing
Maestro-specific to parse: a Maestro JUnit-XML file has the same
<testsuite>/<testcase> shape
as everyone else’s. The flag exists to label the launch as Maestro in the dashboard, not to unlock
different parsing behavior — and on this path it is not optional. The CLI identifies a results file by
what is inside it, and a Maestro report’s root element is an ordinary
<testsuite>, so naming the file
maestro-results.xml changes nothing: without
--format maestro the launch is labeled plain JUnit.
The reporter above has no such step — its report says which framework produced it. Authenticate the CLI once
with your Qualflare access token, stored as a CI secret — see the
CLI docs.
What you get on top of Maestro’s own output
- The flow itself, not just its verdict. With the native reporter, a failed launch shows which command failed, what the steps before it did, and the screenshot Maestro took — the detail that decides whether it is an app bug or a selector that stopped matching.
- AI failure clustering. When a backend change breaks 15 Maestro flows across screens, Qualflare groups them by root cause so you triage a handful of clusters instead of 15 stack traces.
- Flaky-flow scoring from history. Maestro’s own JUnit-XML doesn’t carry a retry/flaky flag, so Qualflare scores each flow’s flakiness from its pass/fail pattern across CI runs on the same branch — the signal a single run’s output can’t give you.
- Framework-agnostic aggregation — the actual differentiator. Maestro Cloud is building its own flake detection scoped to Maestro flows specifically. Qualflare’s view spans your whole mobile stack: Espresso, XCTest, Maestro, and everything else land in the same dashboard, so an Android-only Espresso regression and a Maestro E2E flow failing on the same build show up side by side instead of in two unrelated tools.
- Per-launch risk. Every CI run becomes a “launch” with a risk rating, the failing areas, and recommended next steps — a ship / don’t-ship signal that arrives with the results.
- History & trends. Pass rate and flakiness over time across branches and platforms — the aggregation a per-run report file can’t do on its own.
- Incidental reach into React Native and Flutter results. Maestro drives the UI regardless of the underlying app framework, so if your team also uses it to test a React Native or Flutter app, those results land in the same dashboard too — not because Qualflare has native React Native or Flutter support, but because Maestro’s own cross-platform reach carries through the same JUnit-XML pipeline.
Maestro’s own JUnit output vs Qualflare
| Maestro’s own output | Qualflare | |
|---|---|---|
| History across CI runs | — | Yes |
| Aggregates Espresso + XCTest + Maestro in one dashboard | — | Yes |
| AI failure clustering (root cause) | — | Yes |
| Flaky-flow scoring over time | — | Yes |
| A step per command, nested under runFlow / repeat / retry | — | With the reporter |
| Screenshots of failed steps | Yes (HTML format) | With the reporter |
| Reports a run that died before any results were written | — | With the reporter |
| Local, zero-setup, offline | Yes | — |
They’re complementary: keep Maestro’s HTML report (or --debug-output artifacts)
for local debugging, add Qualflare for hosted, historical CI observability across Maestro, Espresso, and
XCTest together. The rows marked “with the reporter” need
qualflare-maestro;
uploading Maestro’s JUnit-XML on its own gives you the history and analysis rows.
Get AI analysis on your Maestro runs
Start free — put qualflare-maestro in front of your existing command, run qf collect, and get your first AI analysis in minutes.
Testing the native layers too? See Espresso test reporting for Android and XCTest test reporting for iOS, and how to get all three into one dashboard. Want the detail on what the JUnit file does and does not carry? See what Maestro’s JUnit XML leaves out, measured against real 2.6.1 and 2.10.0 output. Chasing intermittent flows? Read fixing flaky mobile tests or the mobile testing complete guide. Qualflare supports Maestro alongside 23+ other frameworks — see the full list, or browse all framework reporting guides. Weighing tools? See how it compares to other test management platforms.
Frequently asked questions
Does Maestro produce JUnit-XML natively, or do I need a converter?
Natively — no converter needed. Running maestro test --format junit --output <file> <flowFiles> writes a standard JUnit-XML report directly, the same as Espresso and unlike XCTest’s .xcresult bundles, which need a separate conversion step. Maestro’s own docs describe JUnit as “the standard for CI/CD integration and for test reporting.”
Does Qualflare run my Maestro flows on real devices or emulators?
No. Qualflare is a results-management and observability layer, not a device-execution cloud — it never provisions or touches an emulator, simulator, or real device. It only needs the JUnit-XML file a run already produced, so it works the same whether that run happened on a local emulator, a self-hosted CI runner, or Maestro Cloud.
Does this replace Maestro Cloud?
No — they solve different problems. Maestro Cloud is mobile.dev’s own execution platform: it runs your flows in parallel on managed devices. Qualflare is the results and analysis layer on top: it ingests whatever JUnit-XML a run produced — from Maestro Cloud or anywhere else — and adds history, AI failure clustering, and flaky scoring. Teams using Maestro Cloud for execution still want somewhere to analyze results over time and alongside their other frameworks, which is what Qualflare adds.
Can Qualflare aggregate Maestro results alongside Espresso and XCTest?
Yes — that’s the main reason mobile teams add it. Point the CLI at each framework’s results file (Maestro’s JUnit-XML, Espresso’s native XML, XCTest’s converted JUnit-XML) using the same project name, and they land in one dashboard: one pass rate, one flaky-test list, one set of defects across Android, iOS, and your cross-platform E2E layer, instead of three separate reports.
How do I send Maestro results to Qualflare?
Two ways. The native reporter is the fuller one: install qualflare-maestro, put it in front of the command you already run — qualflare-maestro -- maestro test .maestro/ — and upload the directory it writes with qf <project> collect ./qualflare-results. Maestro’s exit code passes through unchanged and the reporter makes no network calls. Without it, Qualflare still reads Maestro’s own JUnit-XML: run maestro test --format junit --output maestro-results.xml <flowFiles>, then qf <project> collect maestro-results.xml --format maestro. On that path --format maestro is required, because the CLI identifies a file by its contents and a Maestro report’s root element is an ordinary <testsuite>; the file name is not consulted.
What does the native Maestro reporter add over Maestro’s JUnit-XML?
Everything inside a flow. Maestro’s JUnit-XML carries one line per flow — status, duration, message. The reporter records a step for every command, named from the flow’s own YAML, nested under runFlow, repeat and retry on Maestro 2.10+; it attaches the screenshots Maestro took to the step that took them; it reads tags and qualflare.* metadata out of the flow file; and when a run dies before Maestro writes any results — invalid YAML, no device — it still reports that failure instead of leaving an empty launch. It also replaces the values of --env variables and MAESTRO_* environment variables with ${NAME} in report text. That covers the values it can see and is not a blanket guarantee: values under four characters are left alone, Maestro’s own settings variables are deliberately excluded, and anything set another way — a flow’s own env: block, evalScript, a file a script reads — is invisible to it.
Does Qualflare detect flaky Maestro flows?
Yes, from run history. Maestro’s own JUnit-XML doesn’t carry a per-attempt retry/flaky flag the way some frameworks do, so Qualflare scores flakiness the way it does for any JUnit-XML-only framework: by watching a flow’s pass/fail pattern across launches on the same branch over time, rather than reading a flag out of a single file.
Setup reflects the Qualflare CLI (docs.qualflare.com) and Maestro’s CLI docs as of September 2026. Published 14 August 2026, updated 18 September 2026 for the native qualflare-maestro reporter. Written by İbrahim Süren, founder of Qualflare.